
The gap in the bill
At the end of the month, a bakery, a butchery or a grain miller receives a single figure: total kilowatt-hours. It is enough to know what is owed. It is not enough to answer any of the questions that follow.
Which machine is driving the bill? Is the financed freezer actually being used, or has it been switched off at the wall? Why was this month a third higher than last? Is that mill drawing more than it did when it was new, which usually means something is wearing out?
Traditionally there is one answer: fit a sub-meter to every appliance. It works, and it is how we gather the data that teaches our models. But as a commercial product it does not hold up. Every appliance needs its own device, installed, powered, maintained and eventually replaced, at every site. For a business financing one machine, the monitoring can cost a serious fraction of the machine.
Appliances have fingerprints
There is another way, and it rests on a simple physical fact: different appliances draw power differently, and those differences are visible in the total.
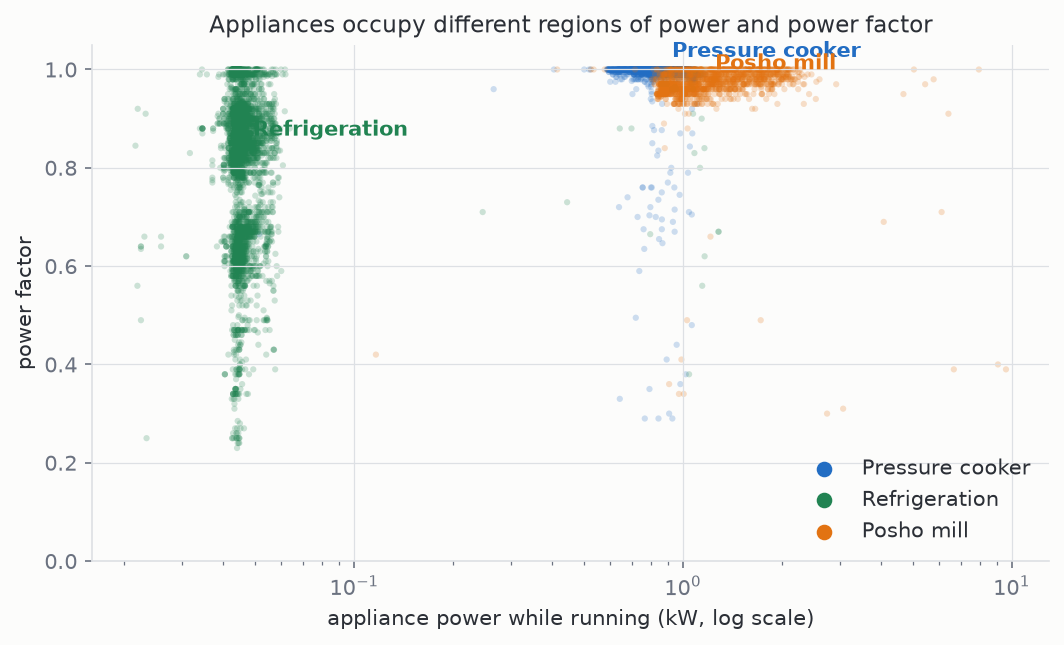
A pressure cooker is essentially a heating element. It pulls a steady, clean load and switches in long blocks as its thermostat cycles. A refrigerator is a motor. It draws much less, in short repeated bursts through the day and night, and it loads the supply in a way a heating element never does. A posho mill is a bigger motor again, and it works in short concentrated runs whose draw rises and falls with the grain going through it.
Put a trained eye on a chart of a site's total power and these patterns are there to be read. Non-intrusive load monitoring is the practice of teaching software to read them, so that a single meter reading can be separated back into the machines that produced it.
What it gives you
PowerPay's load monitoring turns one meter's readings into an appliance-level picture of a site, updated as new readings arrive.
Runtime per appliance
How many hours each machine actually ran, day by day. The fastest way to tell whether a financed asset is earning.
Energy and cost split
Kilowatt-hours and shillings attributed to each appliance, priced at the current Kenya Power tariff.
Fault and anomaly alerts
A fridge cycling too often usually means a failing seal. A cooker running long usually means a leaking lid. You hear about it early.
A plain-language summary
A short written report, in ordinary words, delivered to a phone. Not a dashboard somebody has to learn to read.
What it looks like
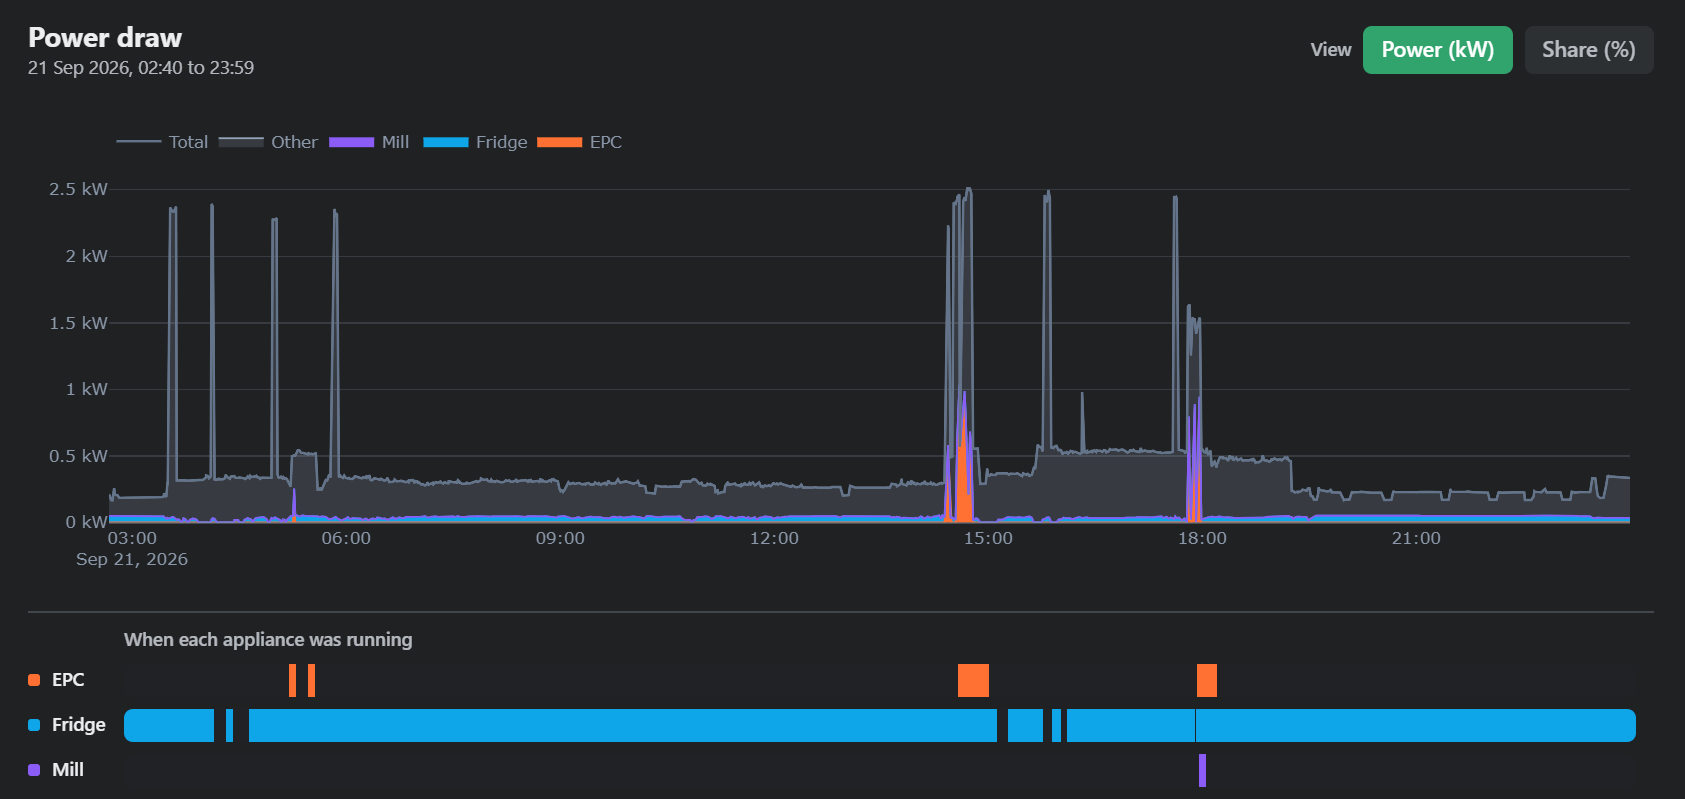
Below is a real day at a live site, separated by our engine from the aggregate meter alone. The coloured bands are individual appliances. Nothing was installed to produce this beyond the meter that was already there for billing.
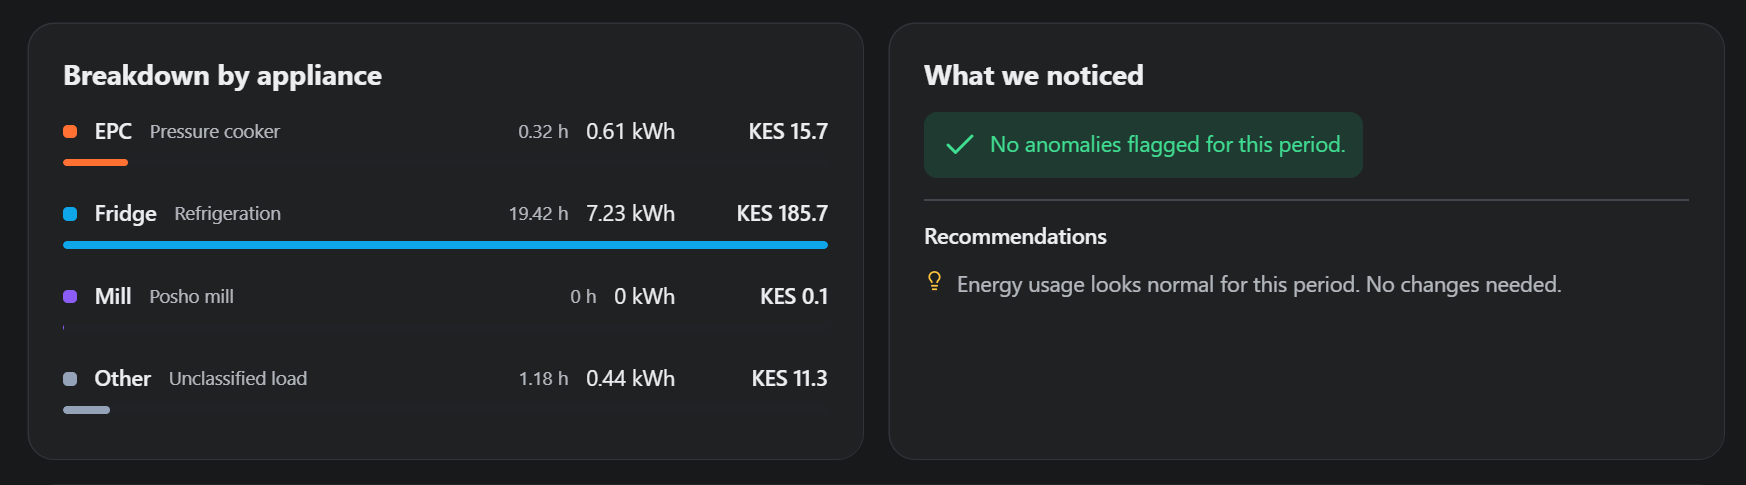
The same day, expressed the way an owner wants it: hours run, units used, and what each machine cost.
Who it is for
- Lenders and asset financiers. Confirm that a financed appliance is in productive use, without asking the borrower and without a site visit. Utilisation becomes evidence rather than assertion.
- Distributors and manufacturers. See how your appliances behave in the field, across many customers, and catch a fault pattern before it becomes a warranty wave.
- Business owners. Find out which machine is responsible for the bill, and get told when one of them starts misbehaving.
Being straight about accuracy
No system that infers appliances from a single meter is perfect, and we would rather say so than have you discover it.
Accuracy depends a great deal on the appliance. Machines with a large, distinctive draw, such as pressure cookers and mills, are identified reliably; across separate customer sites our pressure cooker detection has been consistently strong, and energy figures land within a few percent of separately metered truth. Small, continuously running loads are harder, because the amount of power that has to be spotted can be smaller than the ordinary background noise of a busy site. Where that is the case we deliberately tune the system to under-report rather than over-report, so a customer is never billed for a machine that was not running.
Every model we deploy is tested against separately sub-metered ground truth from real sites, not only against the data it was trained on, and we publish our results internally against that standard rather than the flattering one.
How to start
If your sites already carry PowerPay meters, load monitoring can be switched on against your existing data, with no visit and no new equipment. If they do not, we can supply the metering as part of the same deployment.
See it on your own meters
We will run a disaggregation on a recent period from one of your sites and walk you through what it found.
Request a Demo